FAQ
Meaningful Vision is a leading intelligence partner for the foodservice industry, supporting operators, suppliers, delivery aggregators, investors, franchise groups, and consultants, as they navigate a market shaped by fierce competition, shifting consumer habits, menu innovation and the rise of the eat-at-home economy.
Our insights span the UK, Ireland, France and Germany, covering traffic trends, pricing, promotions, menu development, store openings and closures, and competitive performance across fast food, coffee shops, casual dining, pubs and delivery.
Frequently Asked Questions
What is Meaningful Vision?
Meaningful Vision is a specialist foodservice market intelligence platform that transforms millions of data points into practical, commercial insights. Our data covers footfall and customer traffic, pricing, promotions, menu composition, outlet mapping, and competitive performance. We help brands understand market shifts across segments including the UK fast food market, the Ireland pizza market, the breakfast market and the broader fast food industry in each country.
Our mission is to make complex market activity easy to interpret so businesses can make smarter and faster strategic decisions.
What types of data does Meaningful Vision provide?
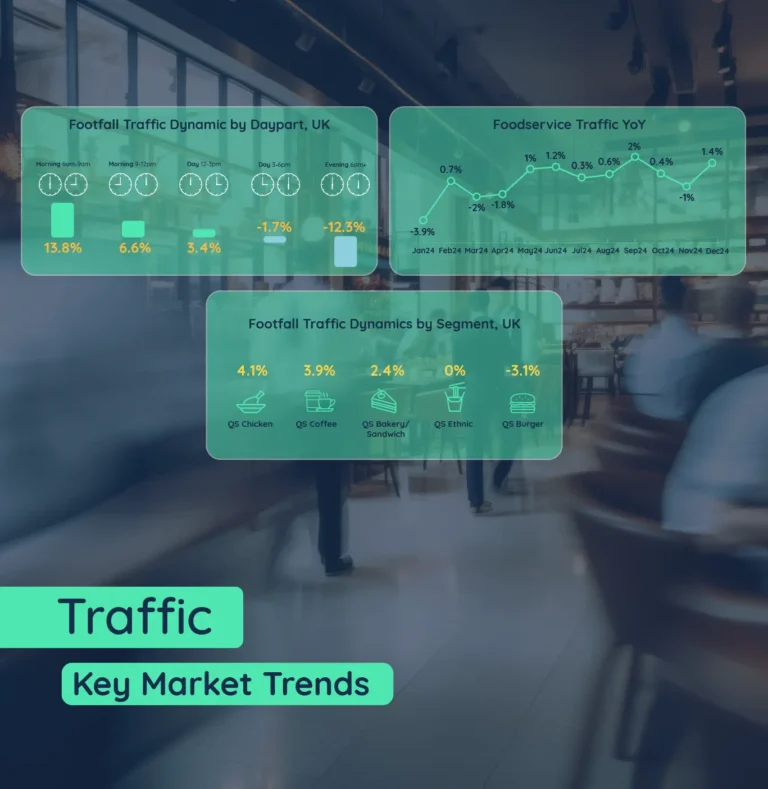
We provide a full suite of high-frequency data, including GPS-based traffic information with hourly and daypart granularity; monthly updated pricing insights captured from restaurant websites, apps and delivery aggregators; comprehensive promotional tracking covering promotional depth, type and duration; and menu intelligence covering new product launches, LTOs and competitor menu changes.
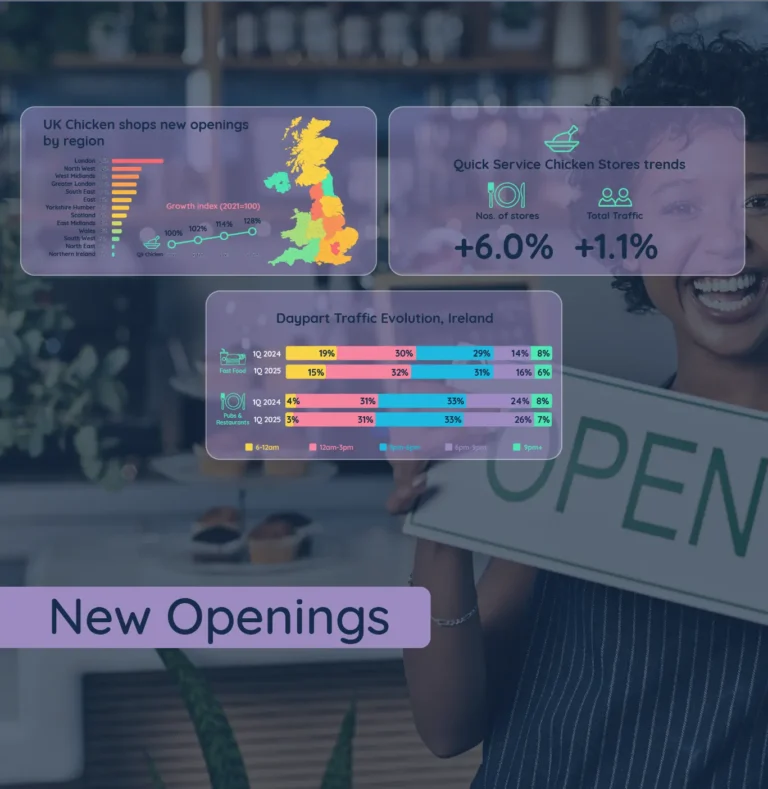
We also monitor store openings and closures, giving our clients a complete view of the competitive environment across markets where the eat-at-home economy is significantly reshaping behaviour.
Our solutions, or a sub-set, are available in the UK, Ireland, France, and Germany.
Which markets and channels do you cover?
Our platform currently covers the United Kingdom, Ireland, France and Germany. This includes thousands of locations across fast food, coffee shops, casual dining and pubs. We track performance across dine-in, takeaway and delivery channels, including platforms such as Uber Eats, Just Eat, Deliveroo, and Wolt.
Beyond restaurant operators, we also support suppliers, manufacturers, distributors and packaging and equipment companies who need to understand the competitive environment and where growth opportunities are emerging.
How accurate is your traffic data?
Our traffic data is built from a mobile panel of more than ten million (UK) monthly users and can achieve up to 95% accuracy at individual-location level.
We provide hourly and daypart breakdowns, allowing businesses to understand consumer behaviour patterns with high precision.
This level of detail supports decision-making in areas such as location planning, cannibalisation analysis, operational hours and competitive benchmarking within fast-food, casual dining, and pubs.
Can you benchmark our brand or our locations against competitors?
Yes. We offer benchmarking at site, city, regional and national levels.
Clients can compare visitor traffic, pricing, menu changes, and competitive openings to build a complete picture of their position in the market. These comparisons are valuable whether you want to understand the competitive pizza market, how many chicken shops operate and drive visitor traffic in the country, or which fast-food chains update their menus most frequently.
Do you support location planning, new site strategy and expansion decisions?
Our data is widely used for new site due diligence and expansion planning. We provide historic footfall trends, growth patterns, competitor density and proximity analysis to help identify high-potential areas.
This includes understanding market gaps and competitor strengths across cities, from central urban areas to local neighbourhoods.
These insights are commonly used to support decisions across categories such as pizza, burger and chicken, and emerging trends linked to the eat-at-home economy.
How often is the data updated?
Traffic data is refreshed weekly, while pricing and promotional data are updated monthly. Store opening and closure information is updated as soon as new activity is detected. Clients access this information through real-time portal dashboards, with the ability to export reports or receive scheduled updates.
Can we customise competitor sets or focus on selected items?
Yes. We frequently build tailored competitor groups, menu categories, item lists and price tiers based on our clients’ strategies.
Whether a brand wants to track 15 essential hero items or analyse the full menu across multiple chains and cities, we can customise the scope.
How do inflation and macro trends impact the industry?
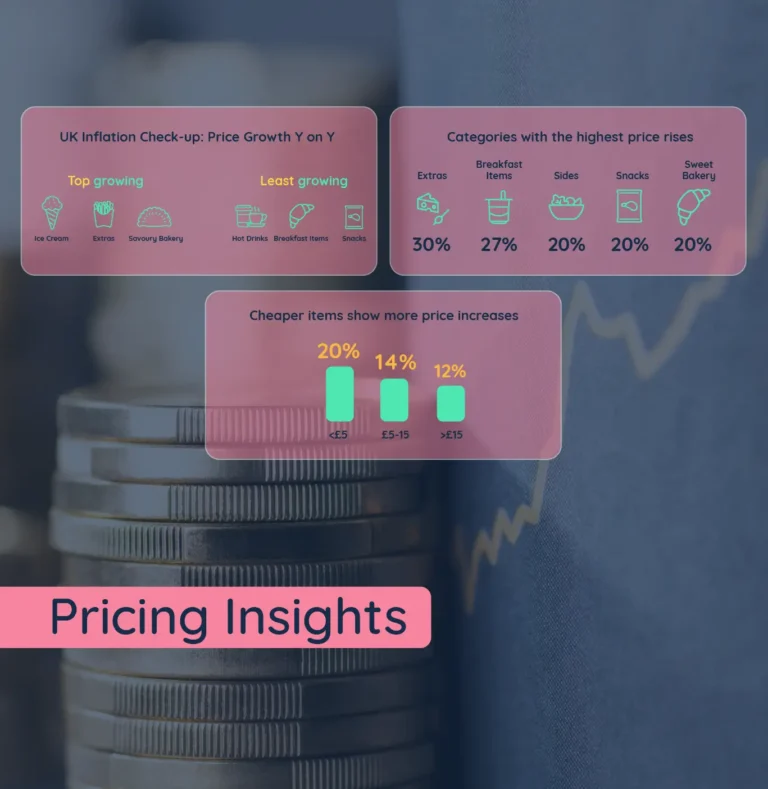
We provide the data required to understand how inflation specifically affects the fast-food, casual, casual dining, and pub industries, including shifts in pricing, promotions, value positioning and customer footfall.
Our insights allow businesses to evaluate whether the market is trading up or down, how discounting is evolving, and how consumer behaviour is being shaped by wider economic pressures.
This is especially important within the foodservice market and the food discount industry.
How do you deliver insights?
Clients receive access to a secure, interactive portal with dashboards covering traffic, pricing, promotions, menus and store development.
We also provide scheduled weekly, monthly or quarterly updates along with analyst support, strategic presentations and ongoing review sessions to ensure teams get maximum value from the platform.
Our online portal additionally includes an AI drivensummary, and a Chat Bot that enables faster access to our clients’ questions.
What does Meaningful Vision cost?
Pricing is tailored to the client’s needs and depends on factors such as the number of competitors tracked, countries included, update frequency and whether the agreement includes a full subscription portal access or a project-based analysis.
Can the data be integrated with our internal systems?
Yes. Depending on the subscription tier, we offer data export, feed delivery and API connections.
These options allow clients to integrate traffic, pricing or promotional data into their own reporting systems, BI tools or dashboards.
What if our country isn’t currently covered?
We currently provide full coverage for the UK, Ireland, France and Germany. For countries outside our core footprint, we can explore the availability of data and advise on the feasibility of custom pilots.
We are continuously expanding our market coverage, and will evaluate feasibility based on requirements outside of our current portfolio..
What does onboarding look like?
Onboarding begins with a scoping call to define objectives, competitor sets and key deliverables.
We then configure your dashboard, prepare your data environment and provide training for your team.
Regular reviews and support sessions are included to ensure your organisation understands how to extract maximum value from the platform.
Do you offer custom reports or tailored research?
Yes. In addition to our core dashboards, we produce white papers, city-level studies, pricing deep dives, footfall analysis, and promotional landscape reports.
These can be tailored by country, region, product category or competitor set, and are often used by brands exploring trends such as fast-food trends for 2025 or the evolving dynamics of the eat-at-home economy.
What are common challenges across your clients in competitor pricing and promo tracking?
Many brands manually benchmark prices, which is time-consuming and incomplete.
Our system automates this by scraping menu data (including PDF menus, apps, and delivery platforms), tracks price changes over time, and benchmarks promotional strategies, allowing manual effort time to be redistributed to other important tasks, whilst upgrading to robust, accurate, reliable, and regular data.
Can you track pricing in countries not tracked currently?
Yes, most likely. The beauty of our methodology, means we can easily add chains, regions, or countries to our current portfolio of brands measured should information be ready available for our data extraction tools to work.
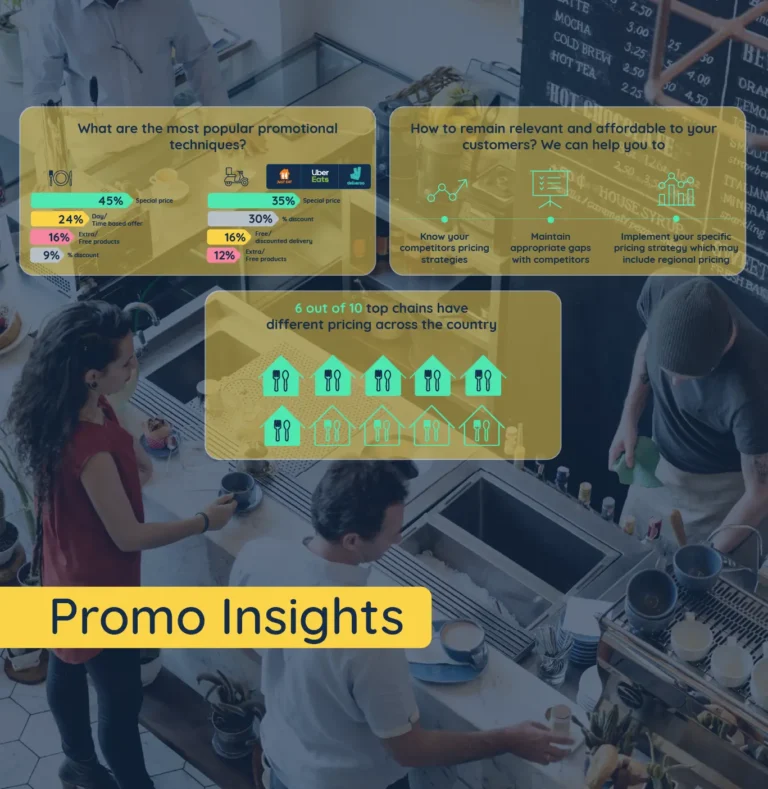
Can you help inform promotional strategies?
Yes! Our database tracks the type, depth, channel, and timing of promotions, enabling you to benchmark your activity against key competitors, study LTO effectiveness, and evaluate ROI by location or channel
How do you resolve data access and accuracy issues in hard-to-track markets for Pricing?
If public menu data is not available online, we leverage additional scraping methods (3rd party platforms, PDF/aggregator extraction), advise on best manual sources, and work closely with clients to fill any data gaps.
For the US and multi-country operations, as an example, we offer custom pilots and consultative support to ensure accuracy and efficiency.
How do you support franchise or multi-brand operations?
For multi-brand portfolios or franchises, we tailor approaches per brand and country, focusing on operational comparability, pricing structures, and competitor sets.
Limitations exist with highly manual menu environments, but we provide strategy to streamline and maximize insight.
How can a client use your insights? What are typical use-cases?
A few common use-cases:
- For restaurant chains: Compare your growth vs competitors, identify key growth opportunities, understand performance vs franchisees.
- For suppliers/manufacturers: Identify which chains to partner with, which products are high-growth, how to price your product, what channels to target (delivery vs dine-in), how to grow together,.
- For new openings: Use location intelligence to assess where to open, analyse competitor density and footfall.
How do we make sure we’re getting maximum value from the platform?
To get the greatest value from the Meaningful Vision platform, it is important to begin by clearly defining your key commercial questions, such as identifying which products may be under-priced compared with competitors or determining the best locations for future openings.
We recommend using the dashboard on a regular basis so you stay ahead of market trends as the data is refreshed monthly. Integrating these insights into regular business reviews, trading meetings and strategic planning sessions ensures the information becomes embedded in decision-making rather than used reactively.
It is also helpful to request training and support early so your team can fully understand and utilise all available features. For organisations seeking deeper analysis, our advisory services provide tailored strategic insight that complements the core dashboard analytics.
For more details, sample reports, or a tailored proposal, please contact our team.

Stay ahead of the market with Meaningful Vision’s high-frequency, data-driven insights that empower foodservice brands to identify opportunities, mitigate risks, and maximise commercial performance.
Our intelligence platform brings together traffic, pricing, promotions, menu development and competitive benchmarking giving you a decisive advantage in a rapidly evolving foodservice landscape.