Uncover our collection of infographics and elevate your competitive intelligence to the next level
Get the ultimate infographic for FREE!
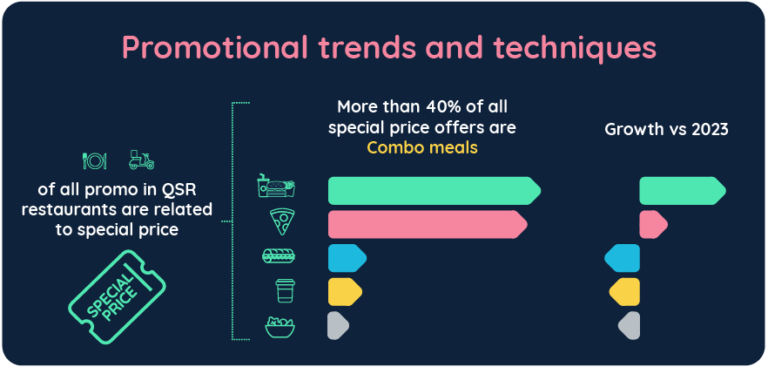
Promotion Trends and Techniques 2022 vs 2023
The fast-food industry demonstrates a variety of promotional tactics that restaurant operators are employing to manage rising living costs while prioritizing customer satisfaction and retention.
Please submit the form to download
infographics
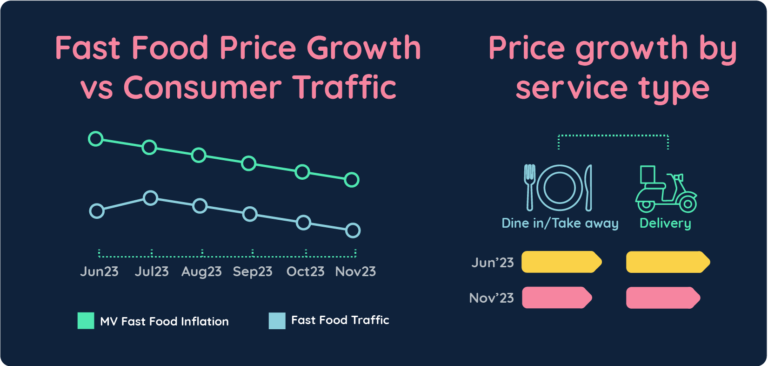
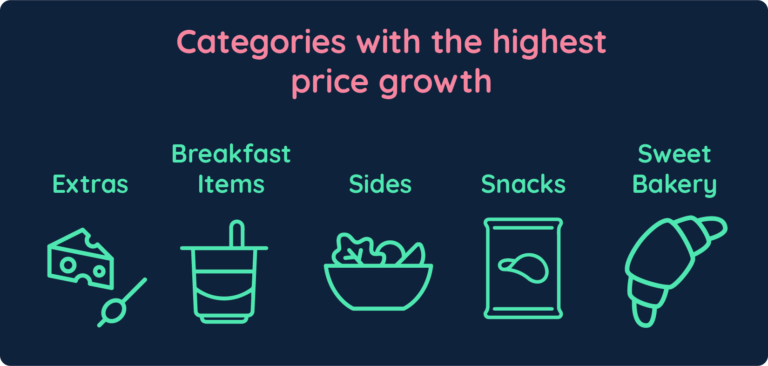
Fast Food Service Inflation Analysis by Service, Product Type and Category
Our report shows price increases vary widely: slower growth for dine-in and takeaway compared to delivery, food items compared to beverages, and premium products compared to lower-priced items.
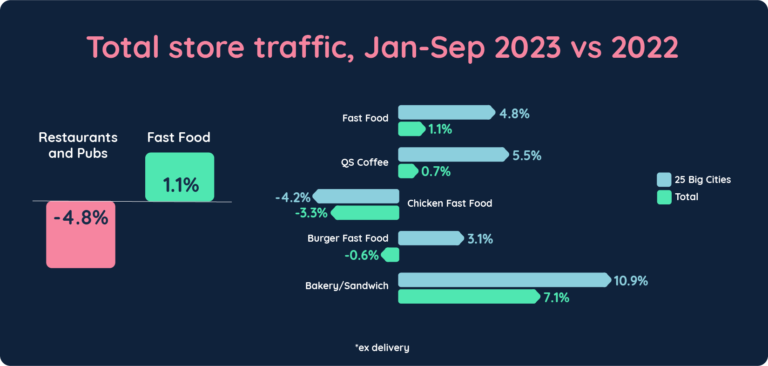
Monthly data on consumer footfall traffic
Despite a dip in consumer footfall traffic, certain market segments show significant growth. Top 25 cities demonstrate a 5 % increase in fast food and coffee shops traffic, five times higher than the market average.
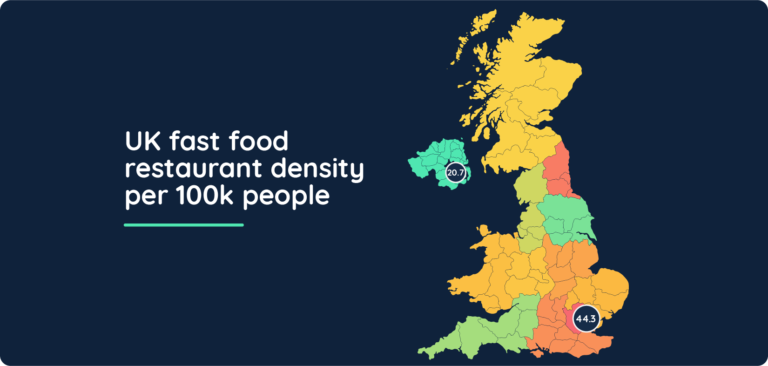
Mapping the Fast Food Landscape: Regional and City Variances in UK Outlets
As of August, on average, there are 29 chain fast-food outlets per 100,000 people in the country. However, these numbers reveal significant regional disparities.
June Sees Accelerated Price Growth in Fast Food
Is the price gap between you and competition growing?