Fast food is the primary focus of Meaningful Vision, as we systematically gather and analyse data on the 70 largest fast-food chains in the United Kingdom. Our comprehensive report encompasses various restaurant categories, including burger quick-service restaurants, chicken shops, bakeries and sandwich shops, coffee shops, Asian food, and pizza deliveries.
Regional Disparities in Fast-Food Density
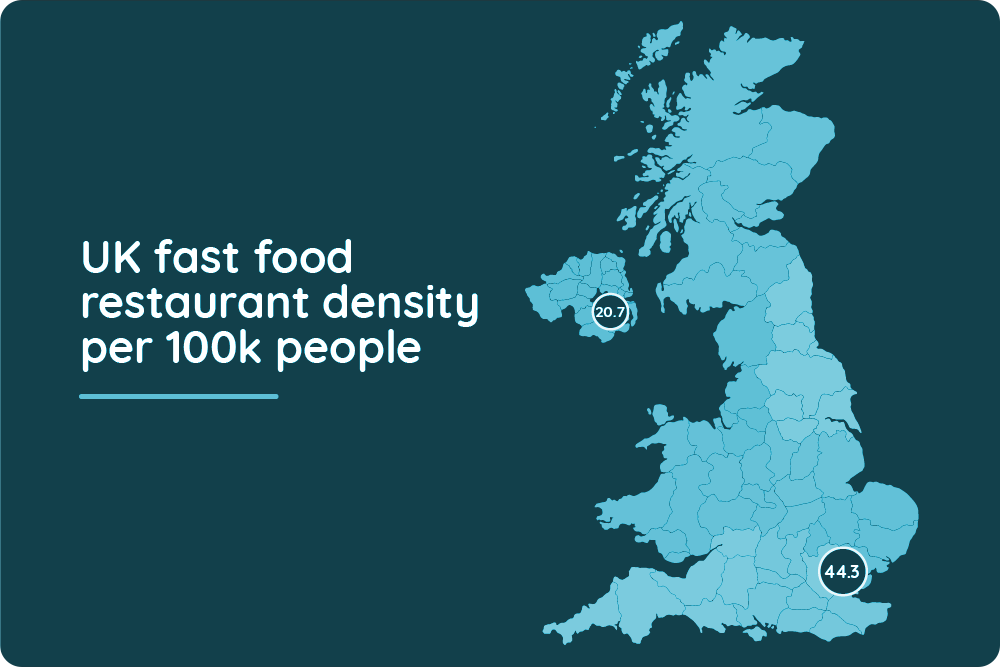
One of the important indicators that enables operators to assess opportunities for new restaurant openings is the density, which is the number of restaurants per 100,000 people. As of August, on average, there are 29 chain fast-food outlets per 100,000 people in the country. However, these numbers reveal significant regional disparities. London leads with 40 fast-food outlets per 100,000 people, followed closely by the North East with 34, the South East with 33, and the East Midlands with 30.
City Rankings for Fast-Food Density
When we analyse the data concerning cities within these regions, we discover that Portsmouth leads with the highest density of fast-food restaurants. The top ten towns or cities with the most fast-food outlets per capita are as follows:
- Portsmouth – 57
- Gateshead – 49
- Edinburgh – 49
- Blackpool – 48
- Cardiff – 46
- Milton Keynes – 45
- Guilford – 45
- Greater London – 44
- Leeds – 41
- Newcastle – 40
Intriguingly, London ranks eighth in this regard, and major cities like Manchester and Birmingham do not even make it into the top 20.
Distribution of Fast-Food Outlet Types
To delve into the distribution of various types of fast-food outlets, let us explore where bakeries, pizza deliveries, burger and chicken quick service restaurants are most prevalent per 100,000 people):
Burger Restaurants
Burger restaurants are evenly distributed across the country. If, on average, the difference between the most densely populated fast-food points in regions and the least populated ones is 2 times, for burgers, this difference is only 1.5. Among cities, Gateshead, Ashford, Portsmouth, Blackpool, and Cardiff have the highest number of burger joints per capita – more than 6 per 100,000 people. These cities outpace London, where the point density is 4.2. The lower number for London may be attributed to a higher number of fast-casual and casual dining burger establishments. Belfast also ranks high in this category – 5.6, despite Northern Ireland having fewer chain fast-food outlets on average. Stockport – 2.0, Bradford – 2.2, and Wolverhampton – 2.3, however, find themselves at the bottom of this list.
Bakeries and Sandwich Shops
The towns or cities with the highest number of bakeries and sandwich shops per 100,000 population are Gateshead -22, Portsmouth – 20, Blackpool -18, Newcastle -18, Stockton-on-Tees – 15. In contrast, Bedford, Plymouth, and St. Albans exhibit significantly lower numbers, with a density of outlets approximately one-third that of the leading cities. York and Cambridge also have modest numbers in this category, while Oxford – 11, boasts 30% more such establishments compared to Cambridge – 8.
Chain Coffee Shops
In the domain of chain coffee shops per 100,000 Edinburgh – 19, Portsmouth – 17, and Chester stand out with the highest density. Notably, Greater London lags behind Chester in this aspect, boasting 11 coffee shops per capita compared to Chester’s 15. Leeds, as well as university cities such as Oxford, Exeter, and Bath, secure positions in the top ten. In stark contrast, Wolverhampton reports the lowest density of coffee shops, with six times fewer outlets per capita compared to Edinburgh – 3.
Chicken Fast-Food Outlets
Chicken fast-food outlets are predominantly concentrated in suburban areas of London, including Croydon – 11, Harrow – 7, and Romford – 6. In contrast, cities like York, Norwich, and Bath have seven times fewer chicken outlets than the leading locales. However, these cities tend to have more burger shops than the national average.
Pizzerias
Pizzerias are the least evenly distributed across regions. Unlike burger shops, the difference between the most densely populated region and the region with the lowest density is 3 times. Ashford, Milton Keynes, High Wycombe, Blackpool, and Aberdeen have 7 or more delivery pizza outlets per 100,000 people. Oldham and Branford complete the list with a rate of fewer than 1.5 points per 100,000.
Distribution of Foodservice Establishments in London
Now, let’s turn our attention to the capital region. We find that the overall density of foodservice establishments per 100,000 people in London stands at 40. Nonetheless, the distribution of these establishments across different areas of the city displays considerable unevenness. The highest concentration is observed in Central London, boasting 208 outlets per 100,000 people. Conversely, the East of London lags significantly behind, with nearly seven times fewer fast-food outlets, numbering only 29 per 100,000 people, a figure that closely mirrors the national average.
West London secures the second position in terms of outlet density, boasting twice as many outlets per capita compared to the East. This trend holds true for various segments, including burgers and sandwiches. Nevertheless, there are exceptions. For instance, coffee shops are notably better represented in the city centre, where every third fast-food outlet happens to be a coffee shop, as opposed to the citywide average of every fourth. Conversely, the distribution of chain pizzerias across London exhibits a relatively uniform pattern, with the North and South reporting slightly higher per capita outlet numbers than the West, lagging only slightly behind the Central areas.
Maria Vanifatova, CEO of Meaningful Vision, reflects on the distribution of fast food outlets, “Despite fast food dominating the UK foodservice market, the variation in distribution of outlets across different regions, cities, and towns, is not always apparent. This variation can be attributed to a range of factors, including demand, business activity levels, age demographics, ethnic composition, and supply, i.e., the availability of suitable sites.
When analysing network operational performance with a view to optimising or expanding the business, data on the number of competing outlets in the studied region is crucial.
This information, combined with data on the average turnover, foot traffic, pricing etc. of outlets in that region, is paramount in making strategic decisions regarding the opening of new restaurants.”
More information on the Fast Food restaurant diversity on QSR Media UK
Contact our team to discus your case.