
Chicken is pulling further ahead of the wider UK fast-food market.
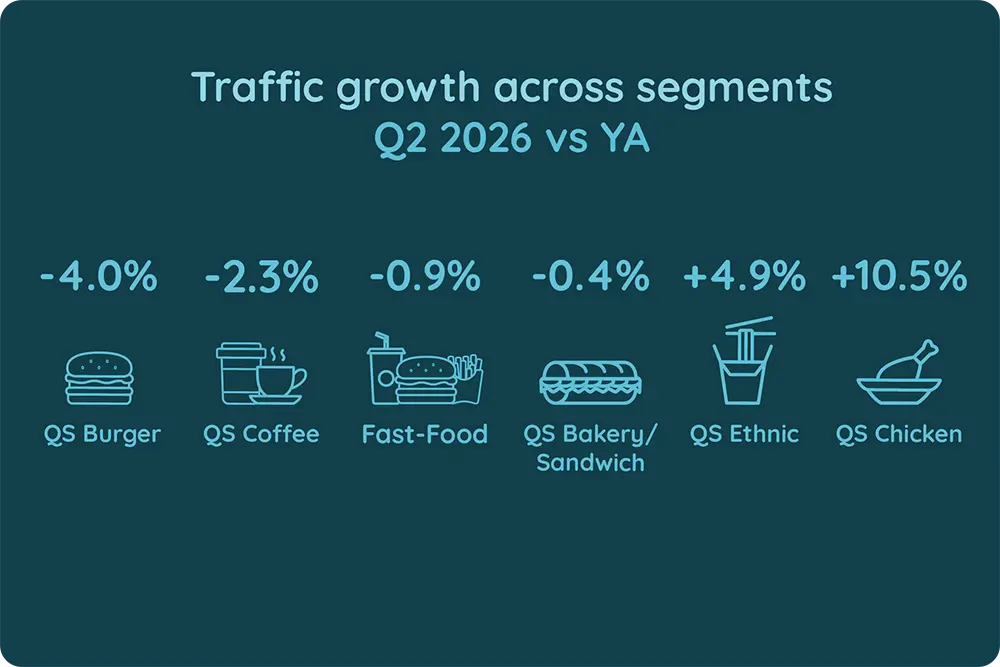
Meaningful Vision data shows chicken restaurant traffic increased by 10.5% year on year in Q2 2026, while burger visits fell by 4.0%. That 14.5 percentage-point gap is one of the clearest signs that consumer demand is moving very differently across fast-food categories.
Overall fast-food traffic was still down 0.9% in Q2. Ethnic quick-service restaurants grew by 4.9%, bakery and sandwich traffic was close to flat at -0.4%, and coffee visits declined by 2.3%.
For operators across the fast-food industry UK, the headline market figure only tells part of the story.
Chicken growth accelerated in Q2
Chicken was already one of the strongest-performing categories at the start of the year. Visits increased by 7.3% in Q1 before accelerating to 10.5% in Q2.
Burger traffic moved in the opposite direction. Visits fell by 2.6% in Q1 and the decline widened to 4.0% in Q2.
Ethnic quick-service concepts also strengthened, with traffic growth rising from 3.4% to 4.9%. Bakery and sandwich traffic remained broadly stable, while coffee weakened slightly.
This makes the fast-food market increasingly divided. Some categories are gaining visits at pace while others continue to lose traffic.
Store expansion is reinforcing the gap
Outlet growth adds another layer to the picture.
Chicken store numbers increased by 6.3% year on year in H1 2026, compared with overall fast-food outlet growth of just 1.0%. Ethnic concepts also expanded faster than the market average, with outlet numbers up 5.4%.
Burger and coffee operators added stores too, but that expansion was not matched by higher customer traffic. Burger outlet numbers increased by 2.1%, while Q2 visits fell by 4.0%. Coffee-shop numbers rose by 0.8%, while visits declined by 2.3%.
For QSR restaurants, this is an important distinction. More stores can increase total brand traffic, but they can also intensify competition between locations. Traffic per store therefore becomes an important measure of underlying performance.
Traffic and store growth need to be read together
The most useful insight is not simply whether a brand is opening more stores. It is whether those stores are being supported by stronger customer demand.
At Meaningful Vision, our foodservice market intelligence tracks customer traffic alongside openings, closures and competitive activity. This allows operators to see whether growth is coming from stronger consumer demand, a larger estate, or a combination of both.
That matters particularly in the quick service industry, where network expansion can sometimes make overall traffic growth look healthier than performance at individual locations.
Chicken currently stands out because both sides of the equation are moving in the same direction: store numbers are rising and customer visits are growing even faster.
Burgers and coffee show a different pattern. Their estates are still expanding, but traffic remains under pressure.
What should operators watch next?
For H2 2026, the question is whether chicken can sustain double-digit traffic growth and whether burger and coffee operators can reverse the decline in visits.
Operators should also watch traffic per store, local competitive density and whether new openings are creating incremental demand or simply redistributing existing visits.
That is where foodservice market research and location-level market intelligence solutions become more valuable than national averages alone.